By Paul Goldberg – Senior Editor | LGBT Business Finance News
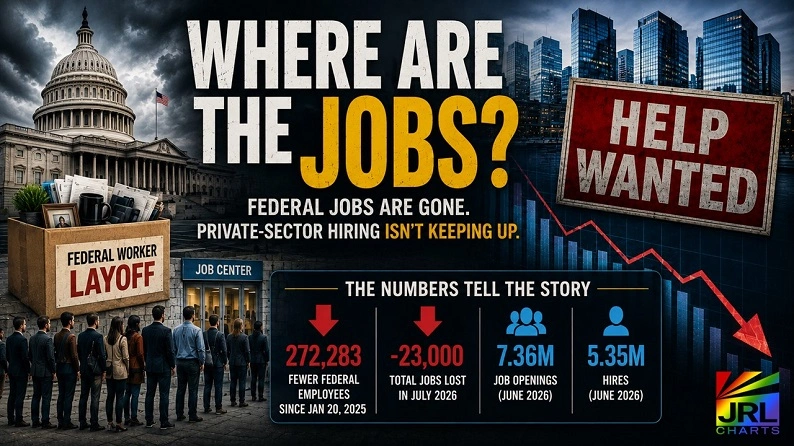
WASHINGTON, D.C. — (August 10, 2026) – For more than a year, the Trump administration has aggressively reduced the size of the federal workforce while repeatedly presenting private-sector employment as the engine that would drive America’s economic future.
The theory was straightforward: shrink government, move workers away from public-sector employment, unleash private enterprise and allow a stronger private economy to create opportunity.
Now Trending on LGBT Business Finance News on JRL CHARTS:
• VA Loses Again as Judge Blocks Third Attempt to Cancel AFGE Contract
• Millions of Working Americans Are Going Hungry—and Nobody Is Talking About It
• America’s ‘Golden Age’? U.S. Job Growth Since January 2025 Tells a Different Story
• LGBTQ Business Owners Join Growing Coalition Against Bank Account Closures
• China’s Rising Yuan Could Hit LGBTQ Businesses Worldwide
• LGBTQ Corporate Participation Plunges 65% in 2026 as DEI Retreat Reshapes Business Landscape
The administration wasn’t subtle about that objective.
In January 2025, guidance associated with the federal government’s Deferred Resignation Program encouraged departing government employees to seek private-sector work, arguing that greater prosperity would come from moving workers from lower-productivity public-sector jobs into higher-productivity private-sector employment.
President Donald Trump’s February 2025 DOGE workforce executive order then directed agencies to “significantly” reduce the federal workforce and generally limited agencies to hiring no more than one employee for every four who departed.
More than 18 months later, there is enough data to ask the obvious question:
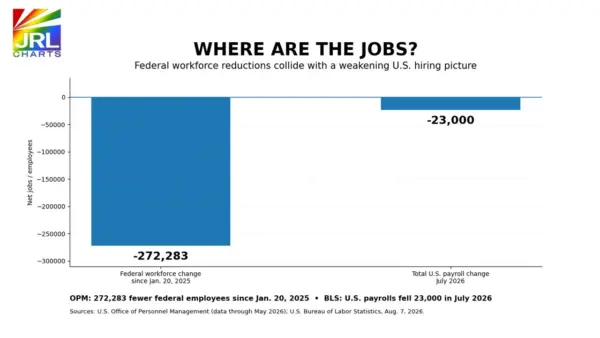
WHERE ARE THE JOBS? The federal workforce has declined by 272,283 employees since January 20, 2025, while U.S. payroll employment fell by 23,000 jobs in July 2026. Sources: OPM and BLS.
Where are the jobs?
It isn’t a Democratic question.
It isn’t a Republican question.
It’s an economic one.
And the latest numbers deserve considerably more scrutiny than the nation’s 4.1% unemployment rate alone would suggest.
More Than 272,000 Federal Employees Are Gone
The Trump administration unquestionably succeeded at reducing federal employment.
According to the Office of Personnel Management’s latest workforce data, the federal workforce has experienced a net decline of 272,283 employees since January 20, 2025.
OPM attributes the contraction to the administration’s workforce reshaping initiatives, including its hiring freeze, early-retirement incentives, reductions in force and Deferred Resignation Program.
The White House has repeatedly characterized that reduction as an economic accomplishment.
In December 2025, the administration declared that private-sector job growth was fueling the Trump economy while highlighting the simultaneous decline in federal employment.
Following January’s stronger employment report, the White House went further, pointing to 172,000 private-sector jobs added during January 2026 alongside a loss of 42,000 government jobs as evidence that the administration was “rightsizing” government while expanding private employment.
January was indeed strong.
But one good month isn’t the same thing as a sustained private-sector hiring boom.
The question is what happened next.
July 2026: America Lost 23,000 Jobs
On August 7, the Bureau of Labor Statistics delivered an uncomfortable answer.
The United States lost 23,000 nonfarm payroll jobs in July.
Even more significant was what happened to previously reported employment growth.
May’s initially reported gain of 129,000 jobs was revised down to 63,000.
June’s gain was revised from 57,000 to just 20,000.
Together, those revisions erased another 103,000 previously reported jobs from May and June.
Over the previous 12 months, payroll employment increased by an average of only 34,000 jobs per month.
That does not mean the United States is experiencing mass layoffs across the economy. In fact, layoff levels remain relatively low.
Economists increasingly describe the current environment differently:
Slow hire. Slow fire.
That distinction matters enormously.
For someone who already has a job, a low-layoff economy can feel relatively stable.
For somebody who has just lost one, a low-hiring economy can feel completely different.
And hundreds of thousands of former federal employees have entered precisely that environment.
Private Employers Added Jobs in July — But Not Many
There is an important distinction in July’s negative headline number.
Private-sector employment did not fall by 23,000. Government losses helped pull total payrolls negative, while the private sector still recorded modest growth.
But modest is the operative word.
The broad private-sector hiring surge that might be expected to absorb hundreds of thousands of displaced public employees isn’t readily apparent in July’s industry numbers.
Healthcare added approximately 22,000 jobs.
Retail trade lost 19,000.
Financial activities lost 14,000 and are now down approximately 121,000 jobs since their May 2025 peak.
Meanwhile, employment showed little change across construction, manufacturing, wholesale trade, transportation and warehousing, information, professional and business services, social assistance, leisure and hospitality and several other major industries.
That’s not economic collapse.
But neither does it resemble a broad-based hiring explosion.
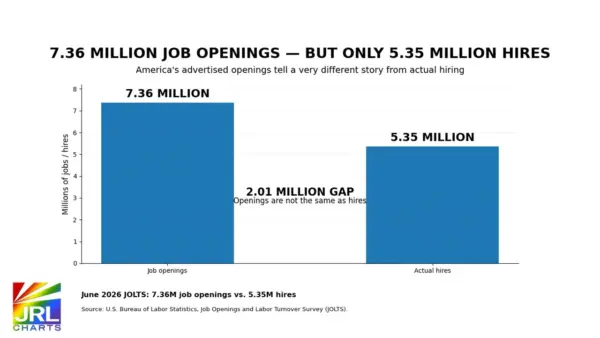
JOB OPENINGS VS. HIRES: The United States reported approximately 7.36 million job openings but only 5.35 million hires in June 2026, according to BLS JOLTS data.
7.36 Million Job Openings Sounds Incredible — Until You Look at Hiring
This is where America’s employment story gets particularly interesting.
The latest Job Openings and Labor Turnover Survey reported approximately 7.36 million job openings at the end of June.
Read that number alone and America’s employment market sounds extraordinary.
More than seven million jobs are supposedly waiting to be filled.
But job openings aren’t hires.
Actual hiring totaled approximately 5.35 million during June.
Job openings declined by 178,000 during the month while hiring increased by only 96,000.
The disconnect doesn’t prove that millions of advertised positions are fake. Job openings and monthly hires measure different things, and openings can remain available across multiple months.
But it does demonstrate why repeatedly pointing to millions of “available jobs” doesn’t answer the question confronting an unemployed worker:
Can I actually get hired?
That distinction becomes particularly important for displaced federal workers whose occupations, salaries, security clearances, geographic locations or specialized expertise may not neatly match whatever jobs happen to be available.
A cybersecurity specialist leaving a federal agency isn’t necessarily interchangeable with a healthcare worker.
A scientist isn’t automatically qualified for construction.
A regulatory attorney can’t simply fill an opening for a registered nurse.
Numbers without occupational context can create an illusion of opportunity that individual workers may never experience.
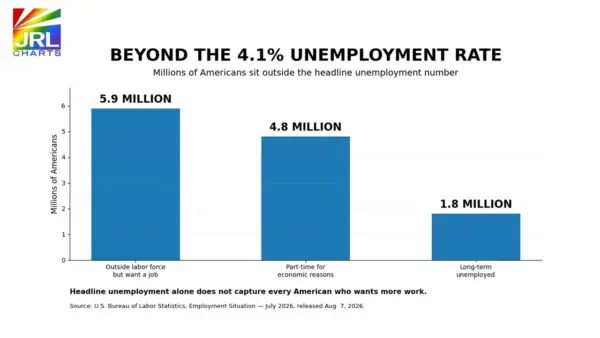
BEYOND 4.1%: July 2026 BLS data show 5.9 million Americans outside the labor force who wanted a job, 4.8 million working part-time for economic reasons and 1.8 million long-term unemployed.
The 4.1% Unemployment Rate Doesn’t Tell the Whole Story
Then comes the number most Americans hear every month:
Unemployment: 4.1%.
By historical standards, that’s low.
And JRL CHARTS isn’t suggesting the Bureau of Labor Statistics is manipulating it.
The unemployment rate is calculated according to longstanding federal methodology.
But understanding what that methodology measures is essential.
To be classified as unemployed, an individual generally must be without employment, available for work and have actively looked for employment during the previous four weeks.
Someone who wants employment but hasn’t recently searched isn’t necessarily counted as unemployed.
That distinction becomes especially important in the July report.
BLS says approximately 5.9 million Americans who were outside the labor force said they wanted a job.
They weren’t counted among America’s 6.9 million officially unemployed people because they had not actively searched during the previous four weeks or weren’t currently available to accept employment.
Among that group were approximately 1.8 million people classified as marginally attached to the labor force — people who wanted and were available for work and had searched sometime during the previous year, but not during the most recent four weeks.
Another 476,000 were classified as discouraged workers — people who weren’t currently searching because they believed no jobs were available for them.
Those Americans exist.
They want employment.
But they aren’t represented in the headline unemployment rate.
Labor-Force Participation Has Been Moving the Wrong Direction
Another number deserves equal attention.
The labor-force participation rate stood at 61.4% in July.
Since January, participation has fallen 0.7 percentage point.
The employment-population ratio has declined another 0.5 percentage point over the same period.
That means America’s unemployment rate can remain relatively low while participation weakens.
Again, this isn’t evidence of statistical manipulation.
It’s evidence that unemployment and labor-force participation measure different things.
And when politicians cite one without discussing the other, Americans receive an incomplete picture of labor-market conditions.
Then There Are 4.8 Million Americans Who Want Full-Time Work
Another group frequently disappears from political discussions about employment.
Approximately 4.8 million Americans were working part-time for economic reasons in July.
These people have jobs.
They’re therefore counted as employed.
But BLS says they would prefer full-time employment and are working part-time because their hours were reduced or because they couldn’t find full-time work.
The broader BLS U-6 measure — which incorporates unemployed people, marginally attached workers and people working part-time for economic reasons — stood at 7.9% in July, nearly twice the headline unemployment rate.
Neither measurement is “wrong.”
They’re answering different questions.
But Americans deserve to see both.
One in Four Unemployed Americans Has Been Looking for at Least Six Months
Perhaps the most troubling statistic in the July report involves duration.
Approximately 1.8 million Americans have been unemployed for 27 weeks or longer.
They now represent 25.5% of all unemployed Americans.
That means roughly one-quarter of officially unemployed workers have been without employment for at least six months.
That statistic fits the picture of a labor market in which layoffs aren’t extraordinarily high but getting hired can be difficult once somebody loses a job.
And there is evidence that displaced federal employees encountered precisely that problem.
As early as March 2025, reports documented federal workers flooding the private employment market following DOGE reductions, with job applications from workers at affected agencies surging.
So the problem hasn’t been completely ignored by national media.
But that leads to a different question.
Washington Covered the Firings. Who Followed the Workers?
The federal workforce cuts generated enormous coverage.
DOGE generated enormous coverage.
Elon Musk generated enormous coverage.
Court battles over federal firings generated enormous coverage.
The political fight over government spending generated enormous coverage.
What received considerably less sustained national attention was the economic experiment happening underneath all of it:
What happened to the workers afterward?
Did they enter private-sector employment?
How quickly?
At comparable salaries?
Did they move into contract or gig work?
Did they retire?
Did they remain unemployed?
Did they leave the labor force entirely?
And most importantly:
Did America’s private sector actually create enough appropriate employment to absorb the workforce Washington deliberately released into it?
Those are measurable questions.
They shouldn’t depend upon whether the person asking watches Fox News, MSNBC or anything in between.
The Administration Deserves Its Side of the Argument
There is another side to this story.
The Trump administration argues that reducing federal employment removes government bureaucracy, improves efficiency and shifts economic activity toward the private sector.
It can also correctly point out that private-sector employment has grown during portions of its tenure, layoffs remain relatively low and unemployment remains historically moderate.
January 2026 demonstrated that strong private-sector job creation can occur alongside reductions in government employment.
And 7.36 million job openings still indicate substantial labor demand across the American economy.
Those facts shouldn’t be ignored simply because other numbers are uncomfortable.
But neither should they end the discussion.
The administration’s proposition wasn’t merely that government employment should decline.
The larger economic argument was that private enterprise was the better destination for American workers.
That proposition can now be tested.
The Numbers Are Asking a Question Washington Should Answer
More than 272,000 fewer federal employees since January 2025.
Only 34,000 average monthly payroll jobs created over the latest 12 months.
23,000 jobs lost in July.
103,000 jobs erased through revisions to May and June.
Approximately 7.36 million job openings, but only about 5.35 million hires in June.
5.9 million people outside the labor force who nevertheless say they want a job.
4.8 million Americans working part-time for economic reasons.
1.8 million long-term unemployed.
A 61.4% labor-force participation rate that has fallen 0.7 percentage point since January.
And a broader U-6 underemployment rate of 7.9%.
None of those numbers, standing alone, proves America’s economy is collapsing.
It isn’t.
They don’t prove that every federal employee who left government is unemployed.
They aren’t.
And they don’t prove that reducing the federal workforce was economically wrong.
That’s a political and economic judgment Americans can make for themselves.
But collectively, the numbers challenge something much simpler:
The assumption that eliminating government employment automatically means the private sector will quickly absorb the people who once held those jobs.
For hundreds of thousands of American workers, the question isn’t theoretical.
It’s personal.
They had jobs.
Washington eliminated many of them.
The private sector was supposed to offer greater opportunity.
Eighteen months later, America’s hiring machine has slowed dramatically.
So JRL CHARTS is asking the question that should transcend party lines:
Where are the jobs?
Coming in Part Two
There’s another number in the July employment report that deserves an investigation of its own.
5.9 million Americans say they want a job but aren’t counted as unemployed.
If millions of Americans aren’t working — and aren’t receiving a paycheck — how are they surviving?
JRL CHARTS will follow the money in Part Two of our special investigation: America’s Missing Workers — If They’re Not Working, How Are They Paying Their Bills?
Stay with JRL CHARTS LGBT Business Finance News for independent U.S. business, employment and economic news that follows the data beyond Washington’s political talking points.

His reporting focuses on federal court rulings, legislative developments, international human rights issues, and government actions impacting LGBTQ communities worldwide.
With nearly two decades of experience, Goldberg is recognized for his balanced analysis, investigative insight, and commitment to accurate, fact-based journalism that informs readers on the political forces shaping equality and justice.